Business Analytics for Translation and Localization: The Quality Index
Classification and Definition
Quality in translation is somewhat complex, with metrics that are hardly straightforward and reasonable to the uninitiated. However, with quality-related KPIs you can communicate your company’s operational systems to your customers in a clear way.
This combination of KPIs is usually called quality index.
Category
Operations, quality, KPIs
Definition
In common business practice, the quality index is a combination of six KPIs:
- The Capacity Utilization Ratio (CUR)
- The DIFOT (Delivery In-Full, On-Time) rate
- The FPY (First Pass Yield) rate
- The Order Fulfillment Cycle Time (OFCT)
- The Rework Level.
CUR expresses the output produced in a given time frame. It reflects the way and the extent to which an organization uses its installed productive capacity. The difference from 100% indicates room to improvement without incurring costs of increasing capacity, while a low value highlights serious process inefficiency.
DIFOT expresses the ability of a business to fulfill orders and meet customer expectations. This KPI provides a measure of the effectiveness and efficiency of processes and supply chain, conveying a measure of delivery reliability.
FPY expresses the percentage of units coming out of a process with no rework, and provides a measure of process effectiveness.
OFCT expresses the average time taken to source, make and deliver a product or service from order to customer receipt. It represents the total “time waiting” experienced and provides a measure of an organization’s delivery capacity in an end to end process.
The Rework Level gives the percentage of items inspected requiring rework and provides a measure of an organization’s operational efficiency at delivering the product as specified by the customer without further correction, alteration or revision.
In Wordbee, users can rate orders, projects, jobs, deliverables, and processes and then use the Business Analytics tools to get statistics.
The feature that allows users to provide ratings for a project and the associated work is called User Ratings.
By enabling and combining Work Quality, Timeliness, and Reliability users can derive a Quality Index.
Rationale
Business analytics (BA) helps you gain insight into strengths, weaknesses, trends and business opportunities. It also helps you measure your business performance, which can be even more useful when insight comes from clients’ feedback.
In Wordbee, clients are given the opportunity to leave feedback and rate orders, projects, jobs and more. The statistics are visualized through the Business Analytics tools.
Impact
Based on whom the information from the User Ratings option applies, measures can be taken to improve performances.
The information can also be used to signal the quality delivered as well as to monitor vendor performances.
Among the User Ratings available, a few pertain to the SERVQUAL instrument, such as reliability (labeled as Work Quality), responsiveness (labeled as Timeliness) and empathy (labeled as Friendliness,) which can be used to derive a customized quality index.
For example, the Timeliness rating expresses the perceived capacity of delivering the requested translation projects at the time expected is comparable to DIFOT. For more on Timeliness, we invite you to refer to Client Ratings.
In addition to Timeliness for OFCT, Adherence to instructions and Reliability are acceptable substitute for FPY, while Work Quality, and Translation quality, are valid substitute for Rework Level.
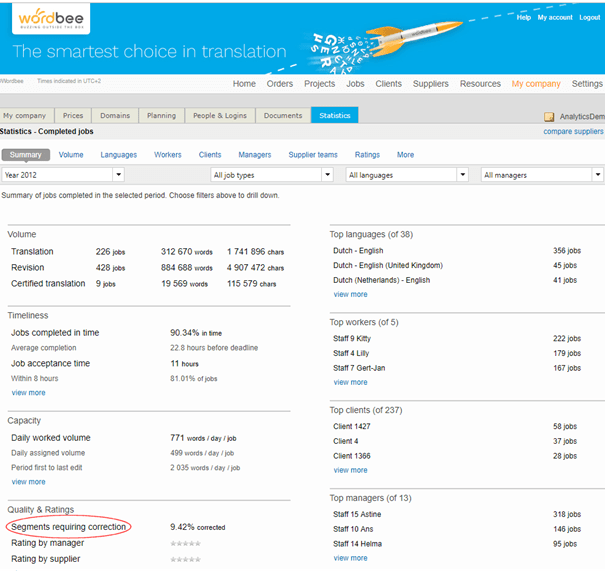
The Rework Level is actually computed in Wordbee as “Segments requiring correction” in the “Quality & Ratings” section of the “Summary” tab in the “Statistics” tab of the “My Company” menu.
User Ratings are mostly subjective as typically expressing the client’s perception with many factors affecting them. Also, clients may not be willing to leave ratings or may only leave some occasionally.
Therefore, it is generally a good practice to double check User Ratings and to take the inconsistency into account when generating KPIs and considering any changes to established working procedures.
Usage Advice
You might be interested to use your quality index as part of your business’s showcase.
If this is the case, you might exploit Wordbee’s exhaustive offering of reports for analytical purposes as well as the option to customize them to gain different perspectives on data.
Reports can be customized using Excel and then added to the system. Just choose the report that contains the type of data you require, then download the corresponding Excel template and apply all your modifications to layout, columns and formulas.
Finally upload your template to the page and your new report is ready for use. Also, most lists in Wordbee include a print button to quickly export data to either EXCEL, JSON or XML.
You might also use Labels to identify information for which no field exists in Wordbee and trace it easily for further processing. For example, you can use Labels to track status.
Finally, the option to generate custom fields to projects allows for including and storing information that is not available in the system out of the box. The data in these fields can then be very useful when exploiting Wordbee’s reporting capability to generate customized reports.
We invite you to Wordbee’s documentation platform for a list of available business analytics reports, know how to configure ratings, how to rate orders and jobs, and how to generate customized reports.
Is this interesting?
Subscribe to get interesting localization podcasts, discussion panels, and articles every month.